

? Đề bài
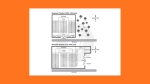
The two pie charts below show the percentages of industry sectors' contribution to the economy of Turkey in 2000 and 2016. Summarize the information by selecting and reporting the main features and make comparisons where relevant.
? Sample Band 8.5:
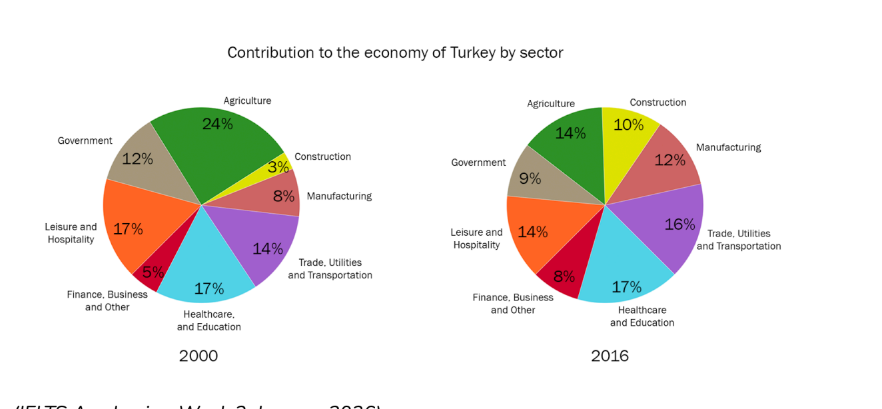
The pie graphs compare sectoral contributions to Turkey’s economy in two separate years, namely 2000 and 2006.
Overall, Turkey’s economic structure underwent a marked shift, from agriculture being the dominant sector in 2000 to healthcare and education emerging as the largest contributor in 2016. Meanwhile, construction and financial-related sectors were the smallest contributors in the respective years.
Regarding the larger contributors, agriculture dominated the economy in 2000 at 24%, followed by a significant fall to 14% in the final year. A similar trend, but to a lesser extent, was seen in leisure and hospitality, which dipped modestly from 17% in 2000 to 14% in 2016. Concurrently, trade, utilities and transportation experienced a slight growth from 14% in 2000 to 16%, whereas healthcare and education levelled off over the period.
Concerning the remaining sectors, manufacturing, financial-related sectors and construction represented relatively small shares of 8%, 5% and 3% of the economy respectively in 2000. By 2016, these figures had undergone an upturn to 12%, 8% and 10% in that order. By contrast, a reduction was witnessed in the government’s contribution to the economy from 12% to 9% over the 16 years.
WORD LIST
| ENGLISH | TIẾNG VIỆT |
|---|---|
| Sectoral contributions | Đóng góp theo từng lĩnh vực |
| Underwent a marked shift | Trải qua một sự thay đổi rõ rệt |
| The dominant sector | Lĩnh vực chiếm ưu thế |
| Emerging as the largest contributor | Nổi lên như lĩnh vực đóng góp lớn nhất |
| Dominated the economy | Chi phối nền kinh tế |
| Financial-related sectors | Các lĩnh vực liên quan đến tài chính |
| Levelled off | Chững lại |
| The government’s contribution to the economy | Đóng góp của khu vực chính phủ vào nền kinh tế |
? Lời kết
? Vậy là chúng ta vừa “chốt hạ” xong sample “The two pie charts below show the percentages of industry sectors' contribution to the economy of Turkey in 2000 and 2016. Summarize the information by selecting and reporting the main features and make comparisons where relevant." ? Hy vọng qua bài này, bạn không chỉ nắm rõ cách xử lý dạng IELTS Writing Task 1 – Pie Chart, mà còn bỏ túi thêm loạt từ vựng xịn và cấu trúc hay để tự tin áp dụng cho mọi dạng biểu đồ tương tự. ? Bài Mẫu Writing
? THAM GIA Group trao đổi thông tin liên quan để cập nhật tình hình hỗ trợ các ngày thi:
https://www.facebook.com/groups/973836027775088
? Group dự đoán đề ielts, nhận tài liệu free: https://zalo.me/g/vsoaup936
Tài liệu dự đoán ib za.lo: 0931.369.966