
? Đề bài
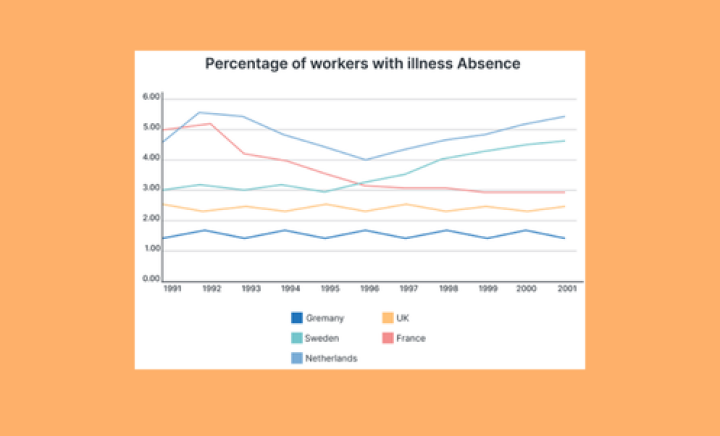
The graph below shows the percentage of wokers from five different European countries thạt were absent for a day or more due to illness from 1991 to 2001
? Sample Band 8.5
The line graph compares the percentages of employees in five European nations who were off work for at least one day because of illness from 1991 to 2001.
What is most striking when looking at the chart is that the Netherlands and Sweden saw net increases in illness absence, which contrasted sharply with France, where the proportions taking sick leave dropped significantly. Meanwhile, the UK and Germany maintained relatively low and stable absence figures.
Looking first at the Netherlands, the proportion of workers taking sick leave generally ranked the highest throughout the decade, except in 1991, when its figure of about 4.9% was slightly edged out by France’s. After peaking at close to 6% in 1992, the rate of illness absence in this country trended downward, reaching a low of around 4% by 1996. However, this decline proved to be short-lived, as the percentage bounced back over the subsequent years and nearly revisited its earlier peak by 2001.
Turning to France and Sweden, these two countries followed contrasting trajectories in terms of sick leave. At the outset, France registered the highest figure, at 5%, nearly double Sweden’s initial 3%. Thereafter, however, the French rate plummeted, reaching the same level as Sweden’s at about 3% in 1996, and it hovered around that mark for the remainder of the timeframe. By contrast, once these two nations converged, Sweden’s absence rate climbed sharply, mirroring the upward momentum observed in the Netherlands. As of 2001, Sweden’s figure had risen to approximately 4.8%, which, despite its rapid ascent, was still lower than France’s starting point.
Finally, only in the UK and Germany was there little change in illness-related absenteeism. Throughout the entire period, these countries recorded lower rates than the other three. In Germany, the figures remained the smallest overall, hovering at roughly 1.5%, amounting to about half the UK’s corresponding rates (around 2.7%). Interestingly, these two nations exhibited a reciprocal pattern: whenever Germany experienced a slight uptick in sick leave, the UK’s rate saw a modest decline, and vice versa.
? Vocabulary
-
Striking (adj): nổi bật, gây chú ý
-
Edged out (v phr): vượt qua
-
Bounced back (v phr): hồi phục
-
At the outset (adv phr): ngay từ đầu
-
Plummeted (v): tụt dốc
-
Converged (v): đồng nhất
-
Contrasting (adj): xu hướng trái ngược
-
The upward momentum (n phr): đà tăng trưởng
-
Rapid ascent (n phr): tăng trưởng nhanh chóng
-
Absenteeism (n): vắng mặt (thường xuyên)
-
Hovering (v): dao động
-
Corresponding (adj): tương ứng
-
Reciprocal (adj): đối ứng
-
Vice versa (adv): ngược lại (cũng như vậy)
? Lời kết
? Vậy là chúng ta vừa “chốt hạ” xong sample “The graph below shows the percentage of wokers from five different European countries thạt were absent for a day or more due to illness from 1991 to 2001" ? Hy vọng qua bài này, bạn không chỉ nắm rõ cách xử lý dạng IELTS Writing Task 1 – Line graph, mà còn bỏ túi thêm loạt từ vựng xịn và cấu trúc hay để tự tin áp dụng cho mọi dạng biểu đồ tương tự. ?
? THAM GIA Group trao đổi thông tin liên quan để cập nhật tình hình hỗ trợ các ngày thi:
https://www.facebook.com/groups/973836027775088
? Group dự đoán đề ielts, nhận tài liệu free: https://zalo.me/g/qvxxkf906
Tài liệu dự đoán ib za.lo: 0931.369.966